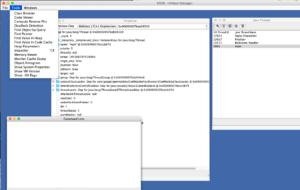
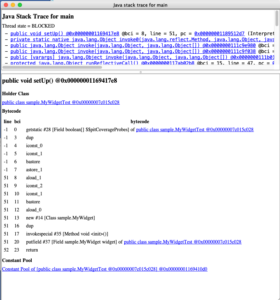
 If you’ve ever tried, or are planning to try instrumenting the JRE, and plan to instrument the entire JRE, you might have run up against some “fun” debugging challenges. For instance, you might have found out that it is possible to generate some bytecode that causes the JVM to produce a segmentation fault while starting. This can be really, really really annoying to debug if you aren’t aware of all of the great tools available. Here are some key tricks (going from most straightforward to least), all written down in one place. I’m aware that this isn’t so much of a how-to to use each of these approaches, as much as it is some pointers down the right path, as when I was trying to figure this all out I had a really tough time finding where to start.
ASM’s CheckClassAdapter
This handy ClassVisitor will do some basic verification of the bytecode you’re outputting. It won’t perform a COMPLETE verification (e.g. some code might pass it that still is wrong), but it will catch a lot, and it’s handy because you can delegate to it (before a ClassWriter, for instance), so you can see exactly where in your code is emiting the invalid code.
Remote Debugging
Do you appreciate the Eclipse debugger? Did you know that you can attach it to a remote process… for instance, one that you start in a crazy JVM with a ton of instrumentation? Yes, you can. This can be really helpful for simple debugging.
A copy-paste one-liner to have a JVM start up and wait for a debugger to connect on port 5005:
-Xrunjdwp:transport=dt_socket,server=y,suspend=y,address=5005
And, if you are debugging instrumentation in maven surefire/failsafe tests, you can set the flag `-Dmaven.surefire.debug` (or `-Dmaven.failsafe.debug`) when starting maven, and when tests start, it will first wait for the debugger to connect (on 5005).
“Fastdebug” build of OpenJDK
There are a ton of flags available to you when you use a special version of OpenJDK that was compiled with debug support enabled. You can get this by building OpenJDK yourself, and doing ./configure –enable-debug. If you’re on OS X and don’t want to go through the big ball of fun that is building OpenJDK 8 on Mac OS X, here’s a binary build that I made and use myself (1.8.0_71). My absolute #1 favorite flag that you’ll get is -XX:+TraceExceptions. This flag will print out EVERY exception that occurs in the JVM, even if it’s caught and squelched by an app, and yes, even if you are causing an exception while printing an exception (ugh definitely an unpleasant way to crash the JVM). Example:
Exception  (0x000000076af86a88)
thrown [/Users/jon/jdk8/hotspot/src/share/vm/prims/methodHandles.cpp, line 1146]
for thread 0x00007fccf9000800
Exception  (0x000000076af86a88)
thrown in interpreter method <{method} {0x0000000122cb66a8} 'resolve' '(Ljava/lang/invoke/MemberName;Ljava/lang/Class;)Ljava/lang>
at bci 0 for thread 0x00007fccf9000800
Exception  (0x000000076af86a88)
thrown in interpreter method <{method} {0x0000000122e70520} 'resolve' '(BLjava/lang/invoke/MemberName;Ljava/lang/Class;)Ljava/lan>
at bci 32 for thread 0x00007fccf9000800
Exception  (0x000000076af88158)
thrown in interpreter method <{method} {0x0000000122e70650} 'resolveOrFail' '(BLjava/lang/invoke/MemberName;Ljava/lang/Class;Ljav>
at bci 51 for thread 0x00007fccf9000800
Exception  (0x000000076af88158)
thrown in interpreter method <{method} {0x00000001277baef8} 'resolveOrFail' '(BLjava/lang/Class;Ljava/lang/String;Ljava/lang/invo>
at bci 44 for thread 0x00007fccf9000800
Exception  (0x000000076af88158)
thrown in interpreter method <{method} {0x00000001277b9ac0} 'findStatic' '(Ljava/lang/Class;Ljava/lang/String;Ljava/lang/invoke/M>
at bci 6 for thread 0x00007fccf9000800
Exception  (0x000000076af88158)
thrown in interpreter method <{method} {0x0000000122e65af8} 'findCollector' '(Ljava/lang/String;ILjava/lang/Class;[Ljava/lang/Cla>
at bci 23 for thread 0x00007fccf9000800
Exception  (0x000000076b0349a0)
thrown in interpreter method <{method} {0x0000000127733c98} 'exitValue' '()I' in 'java/lang/UNIXProcess'<
at bci 16 for thread 0x00007fccf9000800
Exception  (0x000000076b0349a0)
thrown in interpreter method <{method} {0x0000000127798168} '' '(Lorg/eclipse/debug/core/ILaunch;Ljava/lang/Process;Ljava/l>
at bci 36 for thread 0x00007fccf9000800
You also get -XX:+TraceBytecodes which will dump EVERY single bytecode out to the console as it’s being executed.
Javap, Krakatau and verification
You’ve probably already figured javap out already: the tool included with Java that disassembles .class files and prints out the bytecode in text. Krakatau is an awesome tool written in python that does this too, but ALSO WILL VERIFY YOUR CODE AND PRINT OUT DETAILED MESSAGES (MUST use an old version, e.g. `3724c05ba11ff6913c01ecdfe4fde6a0f246e5db`). Here’s where this comes in handy. Sometimes the JVM gives us really helpful VerifyErrors, like here:
Exception in thread "main" java.lang.VerifyError: Bad type on operand stack
Exception Details:
Location:
Test.()V @26: checkcast
Reason:
Type uninitializedThis (current frame, stack[0]) is not assignable to 'java/lang/Object'
Current Frame:
bci: @26
flags: { flagThisUninit }
locals: { uninitializedThis }
stack: { uninitializedThis }
Bytecode:
0x0000000: b200 0b9a 0016 04b3 000b b200 0e9a 000c
0x0000010: 04b3 000e 1202 b800 142a c000 04b7 0016
0x0000020: b1
Stackmap Table:
same_frame(@25)
From reading the error, we can probably figure out what’s going on, because we see exactly where the problem is: in class Test, method
java.lang.VerifyError: (class: org/apache/batik/ext/awt/image/rendered/PadRed, method: handleReplicate signature: (Ljava/awt/image/WritableRaster;)V) Incompatible argument to function
That’s really really unhelpful, because it turns out that this method, handleReplicate, is huge, and all that it tells us is that somewhere in this method, there’s an incompatible argument to a function. Why wouldn’t it give us all of the helpful information in this error that it does above (with the exact location, and expected stack frame)? We might try to do javap and look at this method and try to figure out what’s going on, but, there might be dozens or hundreds of call sites in it, and carefully inspecting each to see where the invalid call is is annoying.
Enter Krakatau: Instead of using javap to disassemble this class, let’s try using it:
$ python experiments/Krakatau/decompile.py -path target/Phosphor-0.0.2-SNAPSHOT.jar -path target/batik-inst/jar/batik-all.jar org.apache.batik.ext.awt.image.rendered.PadRed
... (output, eventually error as below) ...
817: invokevirtual(245)
Stack: java/awt/image/WritableRaster, .int, .int, .int, .int, .int, .int, .int, .int, edu/columbia/cs/psl/phosphor/struct/LazyArrayIntTags, .int[]
Locals: org/apache/batik/ext/awt/image/rendered/PadRed, java/awt/image/WritableRaster, org/apache/batik/ext/awt/image/rendered/CachableRed, java/awt/Rectangle, java/awt/Rectangle, .int, .int, .int, .int, .int, .int, .int, .int, .int, .int, .int, java/awt/Rectangle, .int, .int, .int, .int, .int, .int, java/awt/image/WritableRaster, .int, .int, .int, .int, .int, .int, .int
Now, we know specifically which invocation was causing the problem (at bytecode offset 817 in that method), and what the stack and locals are at that point that the verifier is calculating. Then, we can look in our instrumentation and see why we are generating this invalid code.
Dragons not to mess with
If you’re trying to instrument every class, you’ll quickly find that there are some things that you just can’t touch. The JVM has hardcoded offsets to some fields of some classes (namely, Object, Short, Byte, Boolean, StackTraceElement, perhaps a few others), and if you instrument these classes and this changes the layout of these fields, you’ll have a bad day. You might get around this by storing whatever auxiliary data you wanted for these types using JVMTI Object Tagging, or a WeakHashMap. Moreover, there are SOME things that you can do to these classes (you can definitely get away with adding a single boolean or byte field to Byte, Boolean, Short and Character, for instance…).
What are your Java instrumentation tips?
Do you have any other debugging techniques for Java bytecode instrumentation? Feel free to share in comments below!

