I was recently wrangling with some nastiness involving several different tools, each of which was performing bytecode instrumentation. The problem was that one tool (Mockito, which I didn’t feel like digging into, and am using as a black-box) was modifying my transformed code, and it was very difficult to tell exactly what it was doing to my code. It is easy for me to dump out class files for the code that I generate, but seemingly hard to get Mockito to do.
Shouldn’t there be some way to simply view/dump bytecode of classes from a running JVM? It’s all just sitting there in the heap, right?
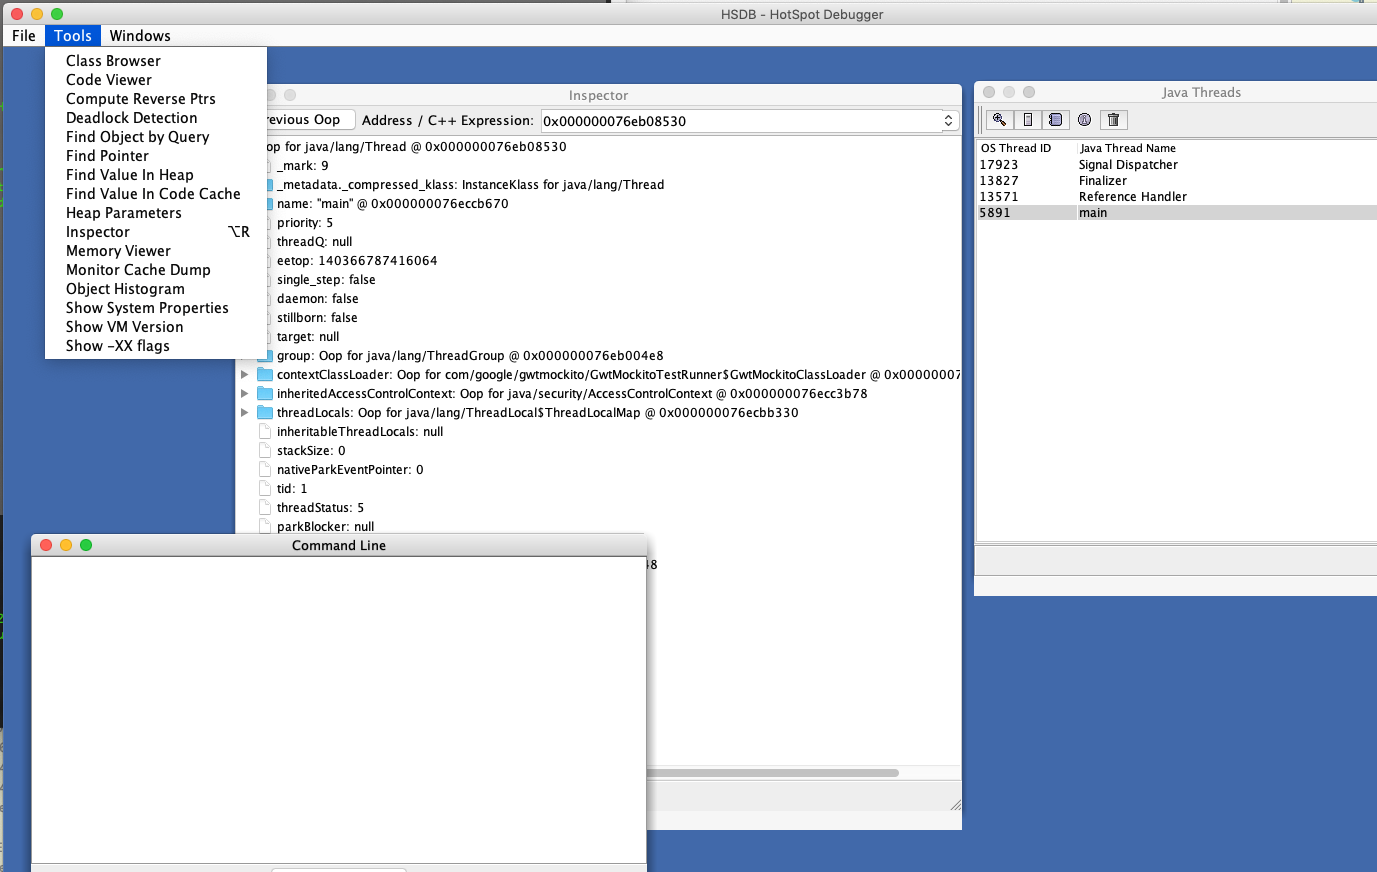
Enter the HotSpot Debugger (HSDB) – which, among many other helpful things, allows you to attach to a running JVM, get a stack trace, and see the bytecode of the actual class that is executing. I found almost no information online about the HotSpot Debugger, save for this Java Magazine article from 2012). Here’s a screenshot of all of the fun options that it provides:
Running hsdb
You can run the gui interface for HSDB from the command line, like this:
sudo java -cp $JAVA_HOME/lib/sa-jdi.jar sun.jvm.hotspot.HSDB
Make sure that JAVA_HOME is set to the same JVM that you want to attach to.
There may be a better way to control the execution with HSDB, but for simplicity I started my JVM (that I wanted to debug), used my regular debugger to pause execution where I wanted to inspect, then attached hsdb, then unpaused the debugger (so hsdb could communicate interactively with the JVM) and explored. If you do this, it is important to unpause the JVM from your (non hsdb) debugger after you attach hsdb.
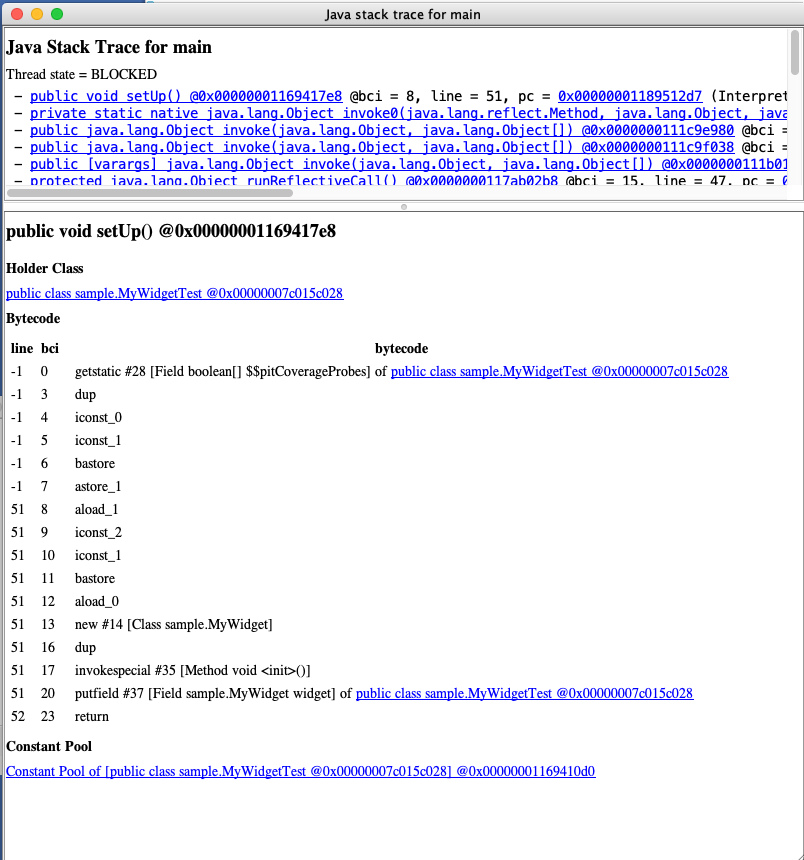
Viewing bytecode of loaded classes
You can view the bytecode for any class loaded by selecting the option from the tools menu. If you want to go straight to bytecode for a method in the current stack trace, then taking the stack trace view will allow you to see the relevant code immediately (screenshot below).